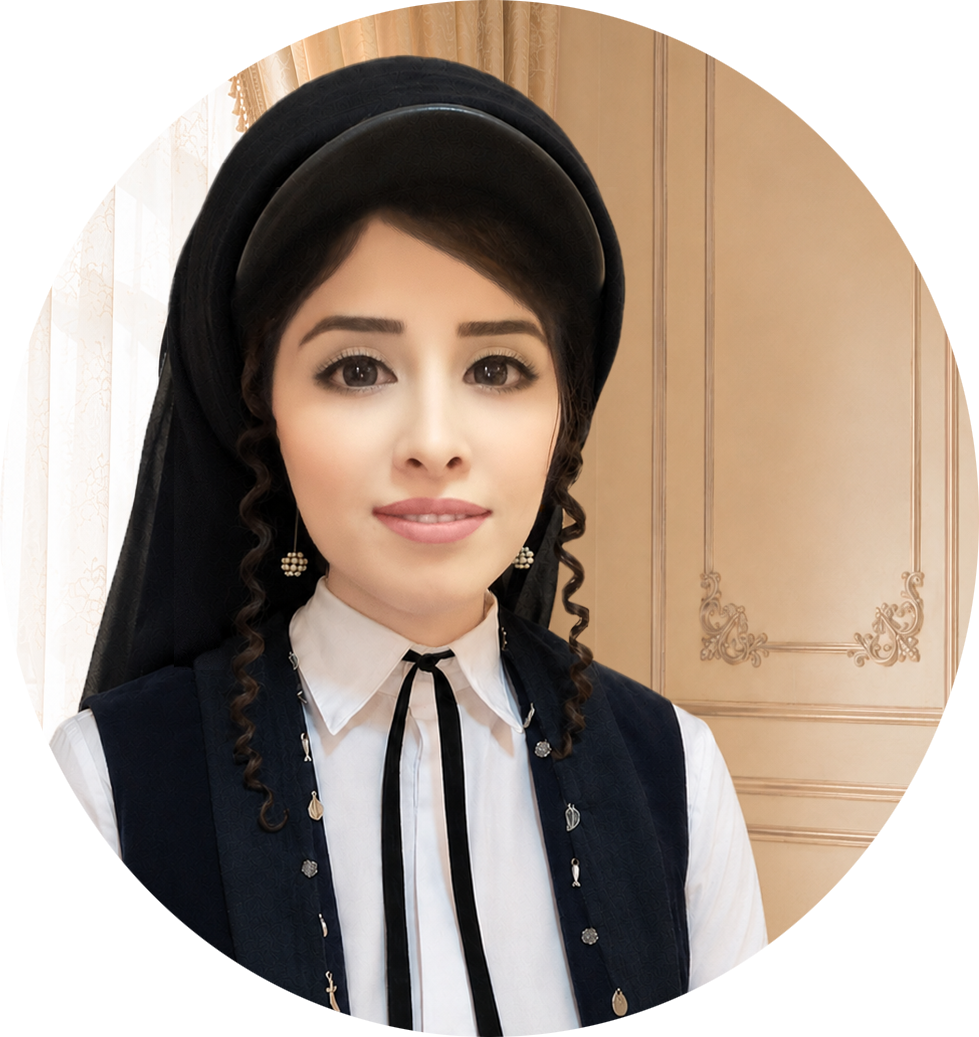
I'm Alina
Nadeem.
A business leader with a passion for data, strategy, and communication.
My experience spans entrepreneurship, marketing, and analytics, but at the heart of it all is my inner Sherlock Holmes: a love for solving problems, uncovering patterns, and turning ideas into results.
Give me a problem, a spreadsheet, and a cup of coffee, and I'm probably already looking for clues. 🔍
About
The person behind
the data.
I'm currently the CEO of Pawsitive Vibes Veterinary Clinic in Al Ain, where I led the launch end-to-end: licensing, branding, hiring, financial modeling, and growth campaigns that reached 700K+ users and onboarded 1,000 customers in two months.
I just completed UC Berkeley Extension's Professional Program in Data Analysis, building a strong foundation in Python, R, SQL, and statistical modeling.
I also recently became a Guinness World Records Certificate Holder, after participating in Kanz's world's largest AI training hackathon, where I built Paw Guardian, my clinic's practice management app with a full relational database on Supabase.
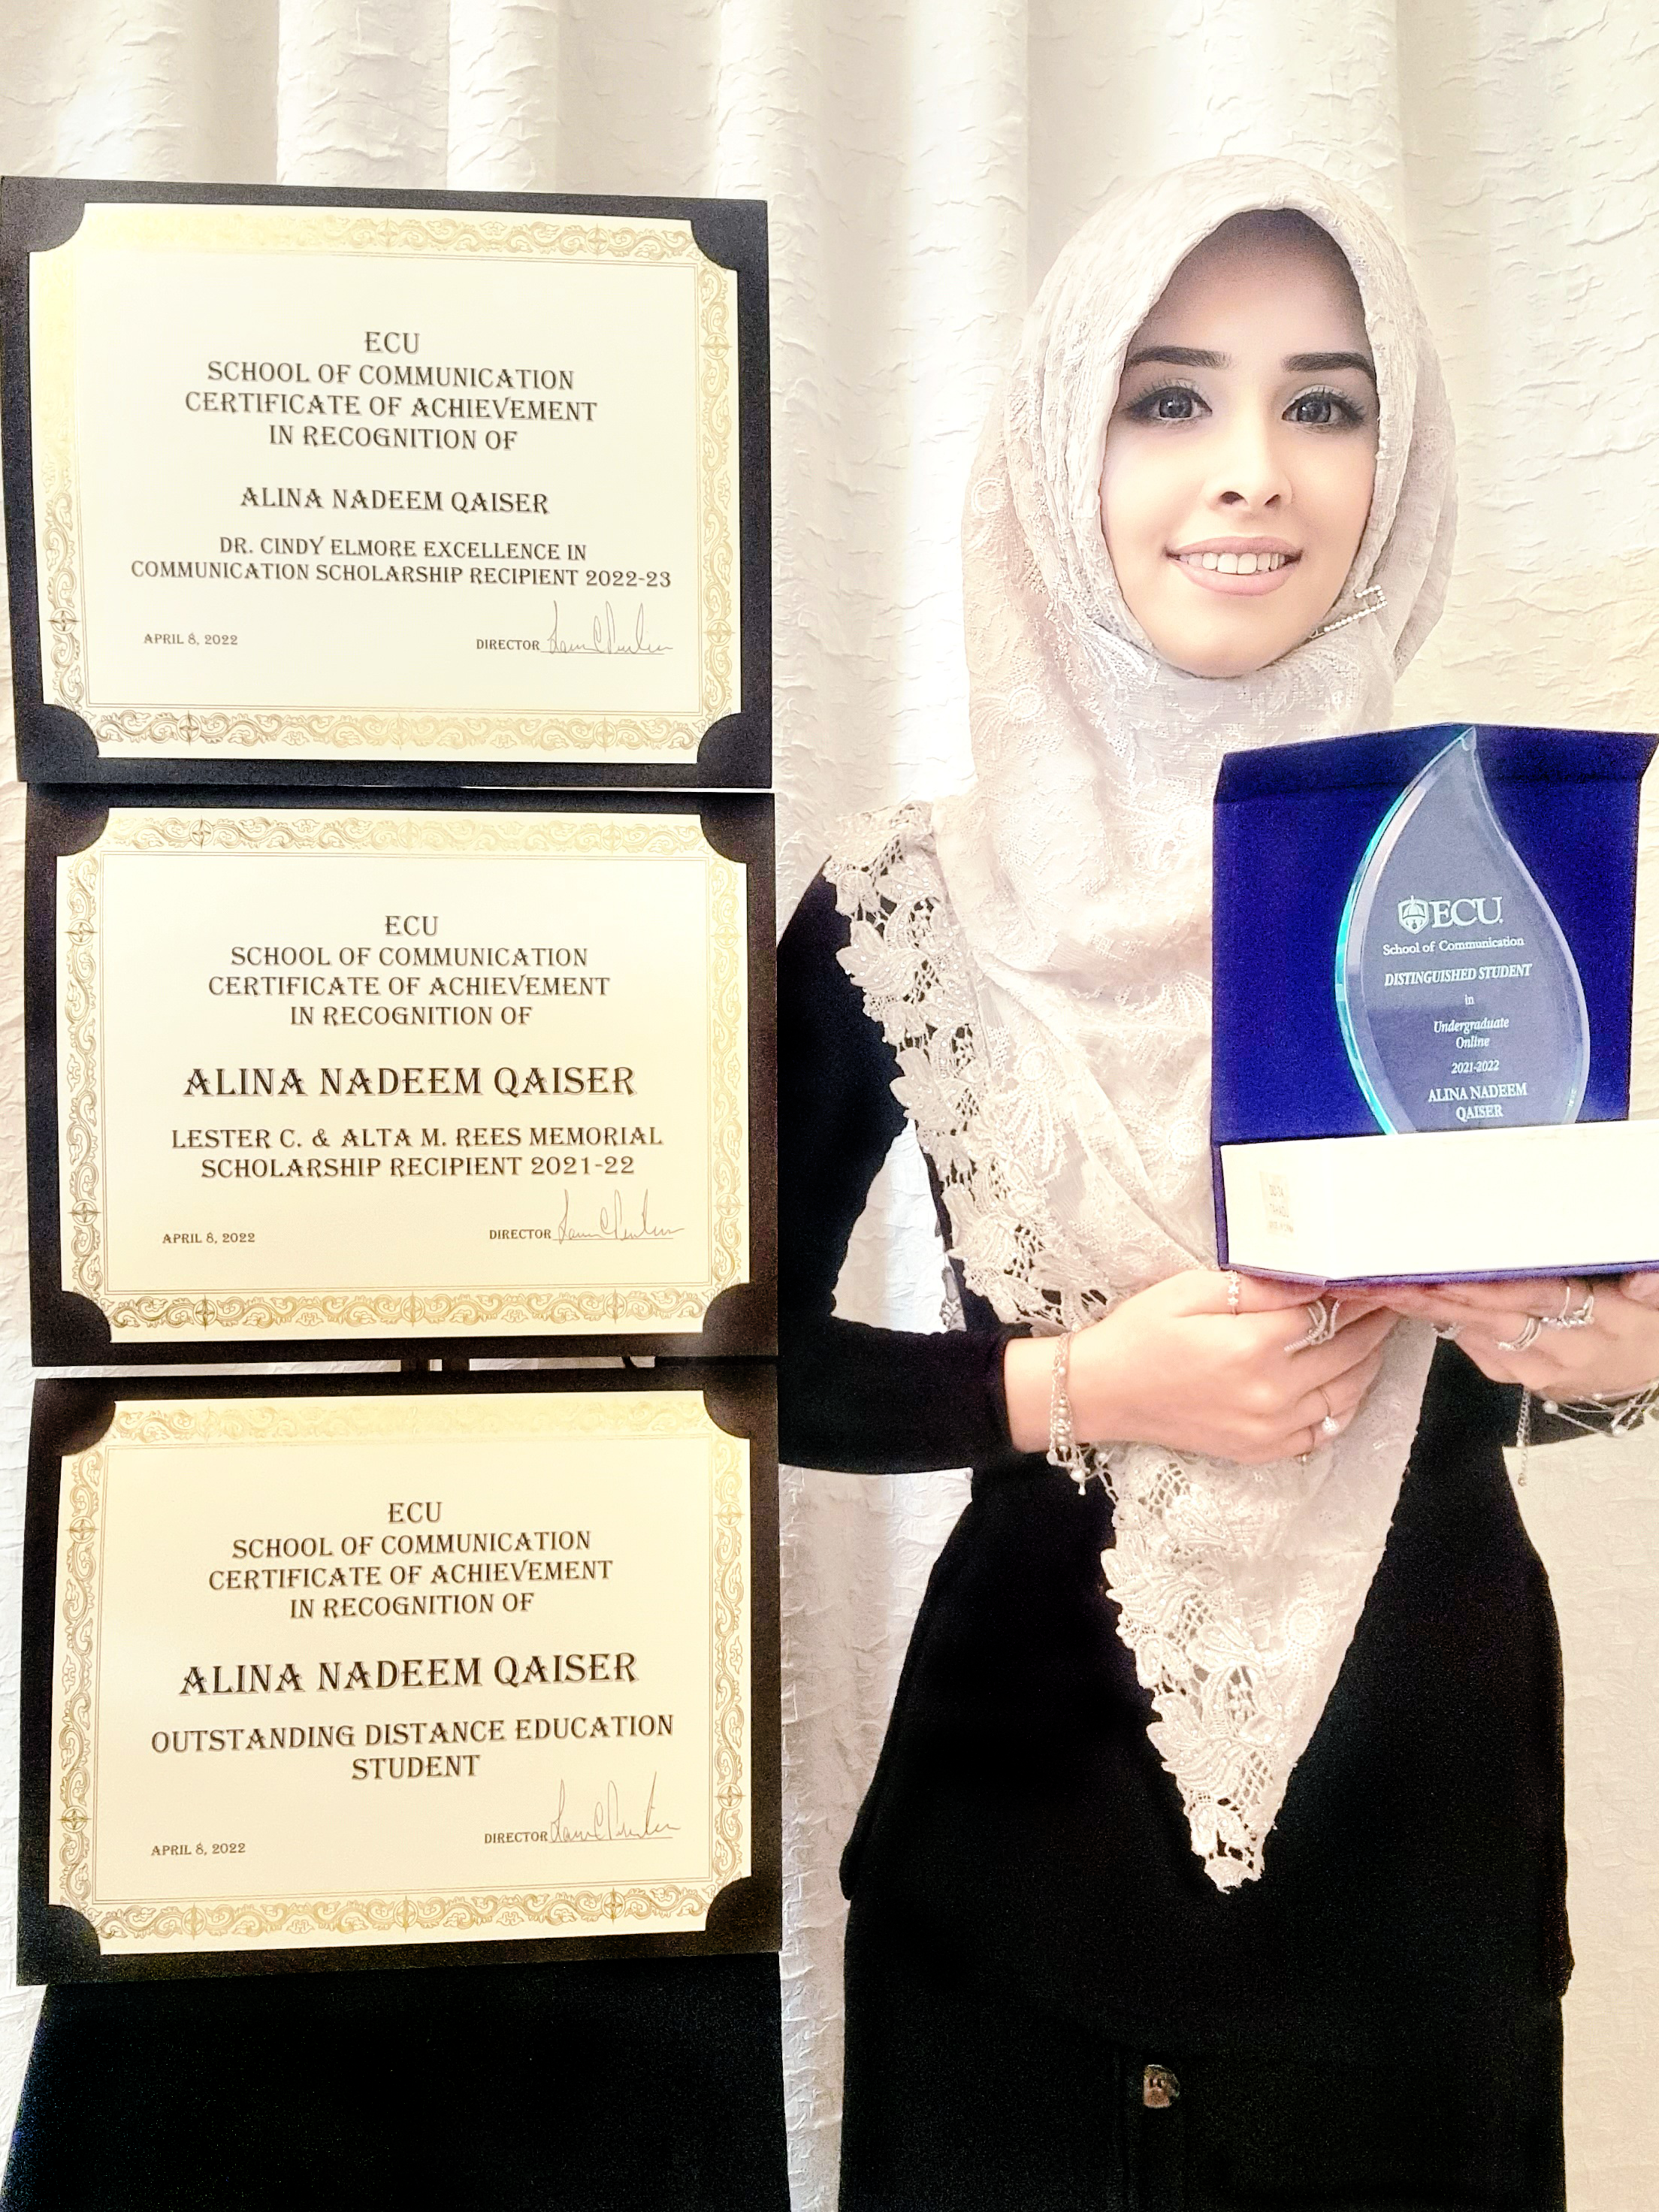
Earlier on, I completed a B.S. in Interpersonal/Organizational Communication (Summa Cum Laude), with a Minor in Business Administration, from East Carolina University.
Along the way, I built hands-on experience through JPMorgan Chase (CADP), Deloitte, and KPMG.
My toolkit includes Python, R, SQL, Tableau, Power BI, Google Analytics, and D3.js. I'm also certified as a QuickBooks Online ProAdvisor, Microsoft Office Specialist, Digital Marketing Expert, and Google IT Support Specialist.
Experience
What I've done.
Led the clinic's full launch — startup operations, licensing, regulatory compliance, and government liaison. Built the brand from scratch: logo, signage, website, and social media. Led Google & Meta Ads campaigns reaching 700K+ users and onboarding 1,000 customers in two months.
Completed practical analytics projects using Python, R, SQL, Pandas, NumPy, Matplotlib, SQLite, Tableau, and Power BI. Built data analysis tools, automated workflows, performed customer segmentation using K-Means and Ward's Hierarchical Clustering, and delivered business-focused insights through reports and presentations.
Built a Tableau and Excel visualization dashboard, documented a business process and identified improvement opportunities, and developed a PowerPoint presentation to communicate key findings to stakeholders.
Unified two data models using Python and classified data in Excel to draw business conclusions. Created a Tableau dashboard and identified the origin of a cybersecurity breach by analyzing web activity logs.
Assessed data quality and proposed mitigation strategies. Built a 3-phase model covering data exploration, feature engineering, and interpretation to identify high-value customers. Delivered a client-facing dashboard with marketing recommendations.
Built Excel sheets for business impact analysis, developed a PPE training program for construction staff, and produced a commercial training video.
Created the official logo and produced digital banner, print, and video ads — driving consistent engagement across 2.4K followers. Boosted traffic by 60% and increased engagement rates by 34%.
Designed and executed a global social media strategy across LinkedIn, Twitter, Facebook, and Instagram for an audience of 10.5K followers. Increased engagement by 15%.
Managed paid campaigns across multiple advertising platforms. Implemented SEO strategies using Ahrefs and SEMRush. Enhanced SEO with Hotjar and Google Search Console.
Projects
Things I've built.
I built this app for my own clinic, Pawsitive Vibes Veterinary Clinic, to replace the spreadsheets we were using to track patients, appointments, and inventory. Using SQL, I built out the entire relational schema myself, tables for owners, patients, medical histories, and inventory, then populated and managed the actual patient records and inventory data through it. I set up real-time database triggers in Supabase so every update syncs instantly across devices, no more stale or conflicting records. I designed the frontend in Lovable and handled all the data modeling and backend logic myself. The app also integrates GPT-4o as a built-in AI assistant staff can query for quick veterinary reference info without leaving the workflow.
View Project ↗Macro view: World at Work Atlas. An explorable choropleth map covering GDP, GDP per capita, employment, unemployment, and poverty across 265 countries and 66 years. A time slider and metric selector let you scrub through history and switch indicators, with countries color-coded by quantile ranking so patterns stand out clearly at a glance, built for browsing and comparison rather than a single guided story.
Micro view: Convergence vs. Concentration. A story-driven companion piece that zooms into how growth is actually distributed. It opens with a Gapminder-style animated scatterplot, then moves through rich–poor ratio and dollar-gap charts before landing on within-country inequality measures: Gini coefficient, Palma ratio, and income deciles, to look at whether gains are shared broadly or concentrated at the top.
Both run on independent Python and R data pipelines that clean and merge data from the World Bank, the World Bank Poverty and Inequality Platform, Our World in Data, and Natural Earth, reconciling ISO3 codes and inconsistent country names across six source files. The D3 visuals were also rebuilt as static charts in Python and R to validate the pipeline end to end.
Built the clinic's full website from scratch. Managed 8 social media accounts and launched 40+ Google Ads and Meta Ads campaigns that reached 700K+ users, onboarding 1,000 customers in two months. Integrated Google Analytics to track traffic, conversions, and ROI — producing regular performance reports to continuously optimize campaigns.
Final project at UC Berkeley Extension. Analyzed U.S. online pet supply sales data — cleaning, merging, and visualizing real transaction datasets alongside competitor data. Uncovered patterns in pricing, seasonality, and customer spending habits using Python.
End-to-end customer analytics study using R. Applied Ward's Hierarchical Clustering and K-Means Clustering to segment customers by satisfaction, loyalty, and purchasing behavior. Developed an ACSI-based satisfaction model and translated findings into data-driven retention and loyalty program recommendations.
Built a Python program for multi-tier dataset analysis: cleaning, min/max/averages/modes/ranks, group-by column operations, and trend exploration. Automated data downloads, used Matplotlib for visualization, and SQLite for data storage. Reduced processing time by 30% and surfaced 25% more insights.
Built an executive Tableau and Excel visualization dashboard, documented business processes with improvement recommendations, and produced a PowerPoint presentation with stakeholder-facing video walkthrough for JPMorgan's Corporate Analyst Development Program.
Created a Python algorithm to merge two incompatible data models. Built a Tableau dashboard, classified data in Excel for business conclusions, and identified the origin of a cybersecurity breach by analyzing web activity logs.
Assessed data quality and proposed mitigation strategies. Built a 3-phase model (data exploration → feature engineering → interpretation) to identify the highest-value customers from 1,000 prospects. Delivered a client-facing dashboard with marketing recommendations for Sprocket Central Pty Ltd.
Designed and implemented a multimedia training solution for a construction workforce, combining research, content development, stakeholder analysis, and digital presentation technologies to improve safety awareness and PPE compliance. Created an end-to-end training program using PowerPoint, video integration, and voiceover production while translating regulatory and operational requirements into clear, actionable guidance for employees and supervisors.
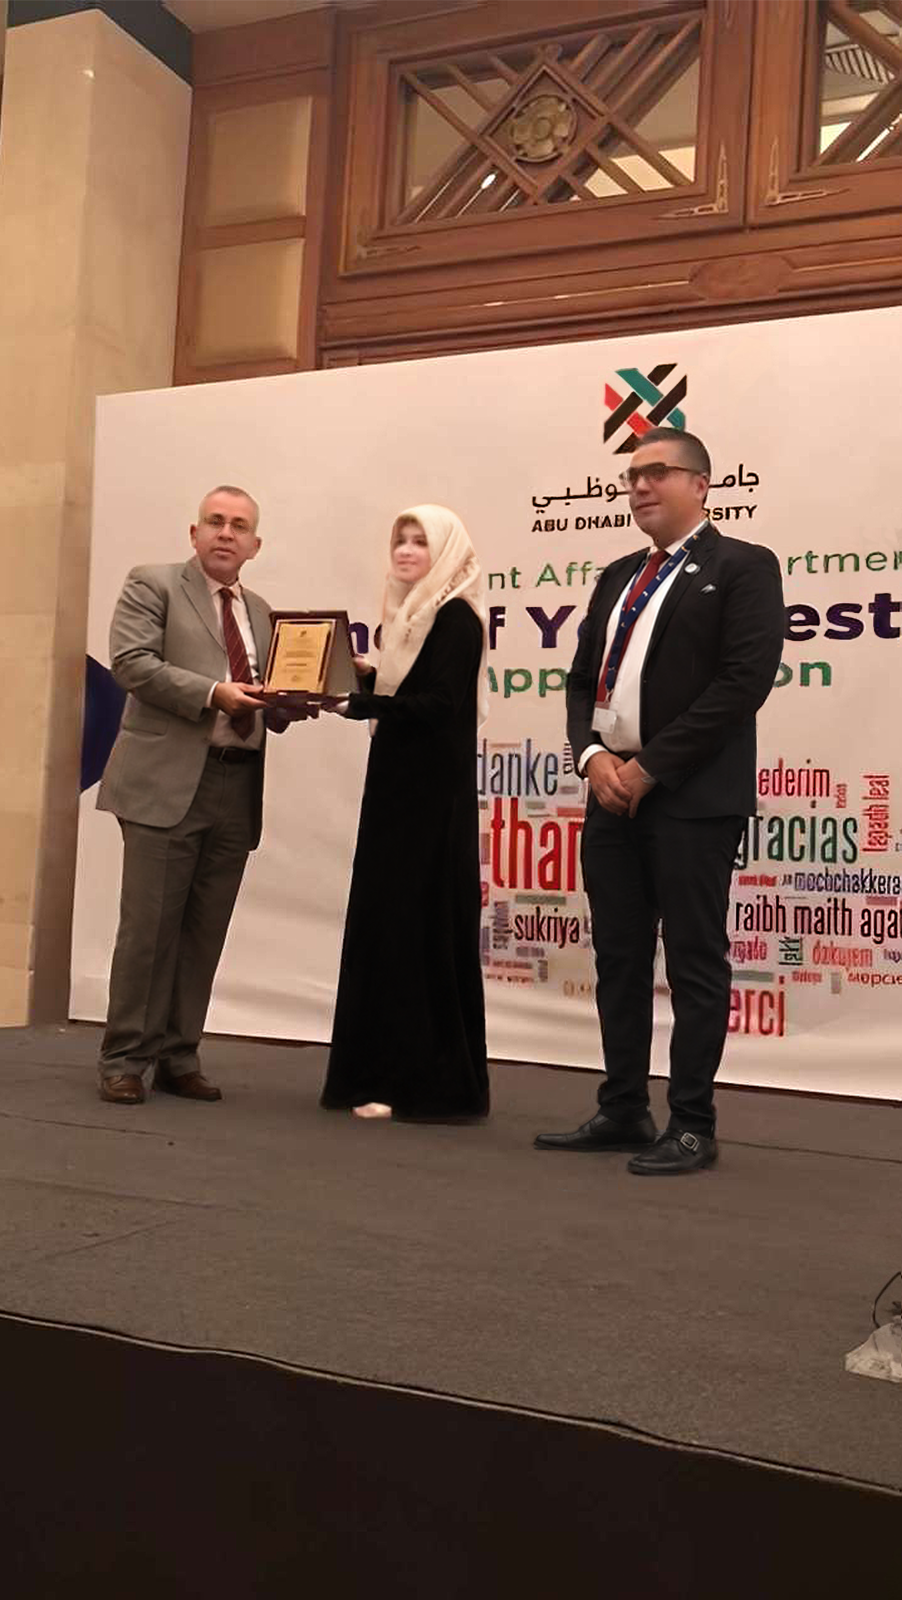
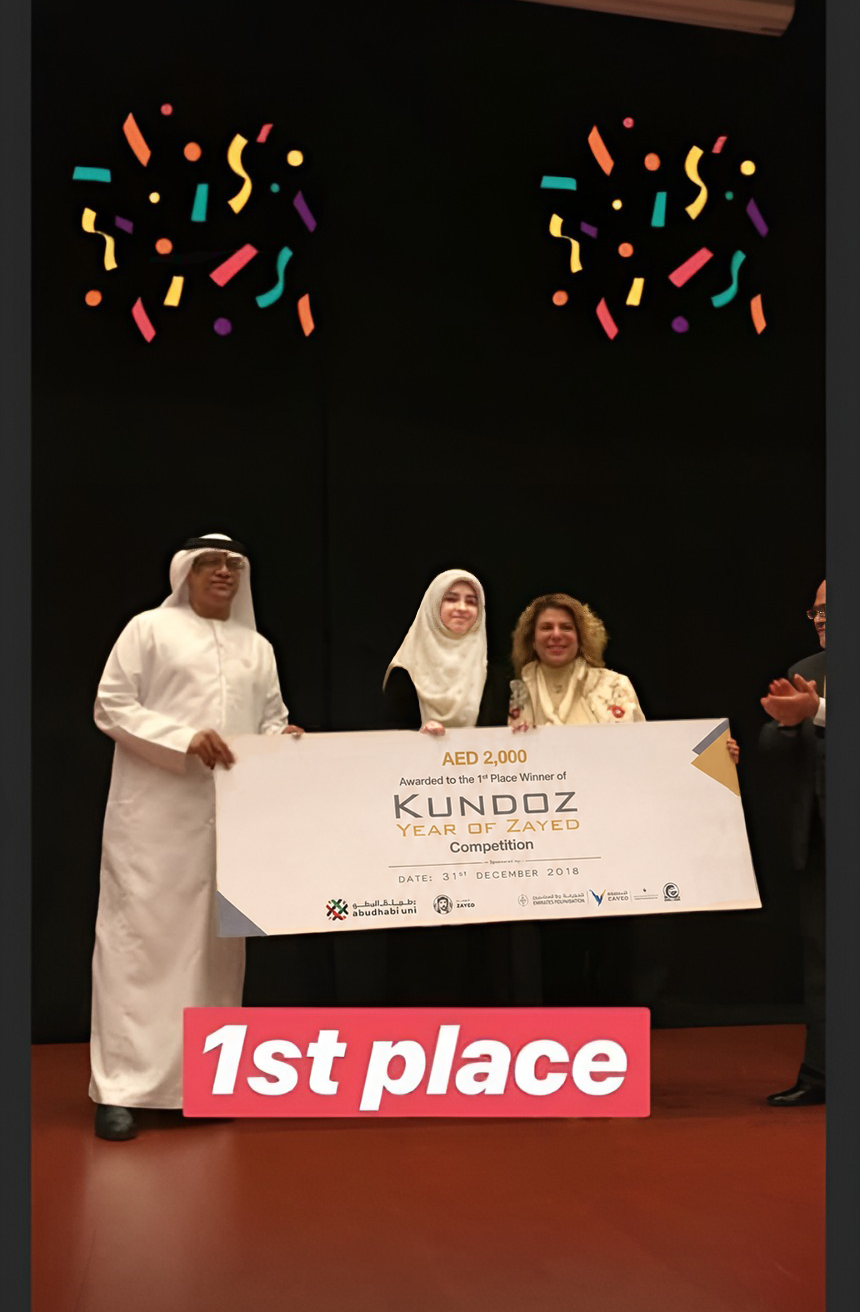
Recognition
Honours & Awards.
Let's connect
Get in touch.
So that's my story, at least so far. Now I'd love to hear yours.
Got a project or collaboration in mind? I'm always happy to connect with fellow data geeks, business enthusiasts, and animal lovers. 🐾